
Insights Hub
Insights Hub gives you real-time visibility into payment health metrics that matter most, from Approval rates, Fraud rates, Chargeback rates and Query Card Performance , right inside the TabaPay portal. Instead of chasing data across systems, your team can focus on diagnosing issues, quantifying opportunity, and improving performance.
Note: Safari web browser is not supported.
Use Cases
- Trend Inquiry: User is able to spot spikes and dips and filter down to the exact transaction type causing the spike or dip and take action accordingly.
- Performance: Identify which BINs, Issuers, Networks, and Card Types are performing best across all your transactions.
Payment Metrics Breakdown
Approval Rate
The Approval Rate dashboard provides comprehensive visibility into authorization performance and decline drivers.
Calculation
Analytic Capabilities Include:
- Daily approval rate trends
- Performance breakdown by Network, Card Type, Value-Added Service, Issuer, and BIN
- Top Network Reason Codes (RCs) ranked by error count
- Top BINs contributing to declines
- Custom filters by Sub-Client ID, transaction type (push, pull, etc.), Network, Card Type, BIN, Network RC, Value-Added Service, and date range
Fraud Rate
The Fraud Rate dashboard provides visibility into fraud exposure and risk performance.
Calculation
Analytic capabilities include:
- Monthly fraud rate and count trends
- Performance breakdown by Network, Card Type, Value-Added Service, Issuer, and BIN
- Top fraud types ranked by fraud amount
- Top BINs ranked by fraud amount
- Custom filters by Sub-Client ID, Network, Card Type, BIN, Network RC, Value-Added Service, and date range
Chargeback Rate
The Chargeback Rate dashboard monitors dispute exposure and downstream risk performance.
Analytic capabilities include:
- Monthly chargeback rate and count trends
- Performance breakdown by Network, Card Type, Value-Added Service, Issuer, and BIN
- Top chargeback codes ranked by chargeback count
- Top BINs ranked by chargeback count
- Custom filters by Sub-Client ID, Network, Card Type, BIN, Network RC, Value-Added Service, and date range
Query Card Performance (AVS/ANI)
AVS — Address Verification Service
The AVS dashboard measures address verification match effectiveness across your portfolio.
Definition:
AVS Success = AVS Code of Z or Y and Network RC of 00 or 85
Analytic capabilities include:
- Monthly AVS success rate and AVS transaction count trends
- AVS success rate breakdown by Network, BIN, and Issuer
- AVS count breakdown by AVS Code, Network RC, and CVV Code
- Custom filters by Network, BIN, Network RC, and date range
ANI — Account Name Inquiry (Only for clients using ANI)
The ANI dashboard measures account name match effectiveness across your portfolio.
Definition:
Analytic capabilities include:
Monthly ANI full match rate and ANI transaction count trends
ANI full match rate breakdown by Network, BIN, and Issuer
ANI count breakdown by AVS Code, Network RC, and CVV Code
Custom filters by Network, BIN, Network RC, and date range
Enhanced Metrics
The Intelligent Metrics section provides a quick snapshot of year-to-date performance, along with summary insights. Giving your team an at-a-glance view of where you stand and where to focus.
How to Use the Insights Hub
First, Log in to the TabaPay Portal.
Approval Rate Metrics
- On the left side navigation, select Insights Hub.
- The Approval Rate metrics page will be the default landing page.
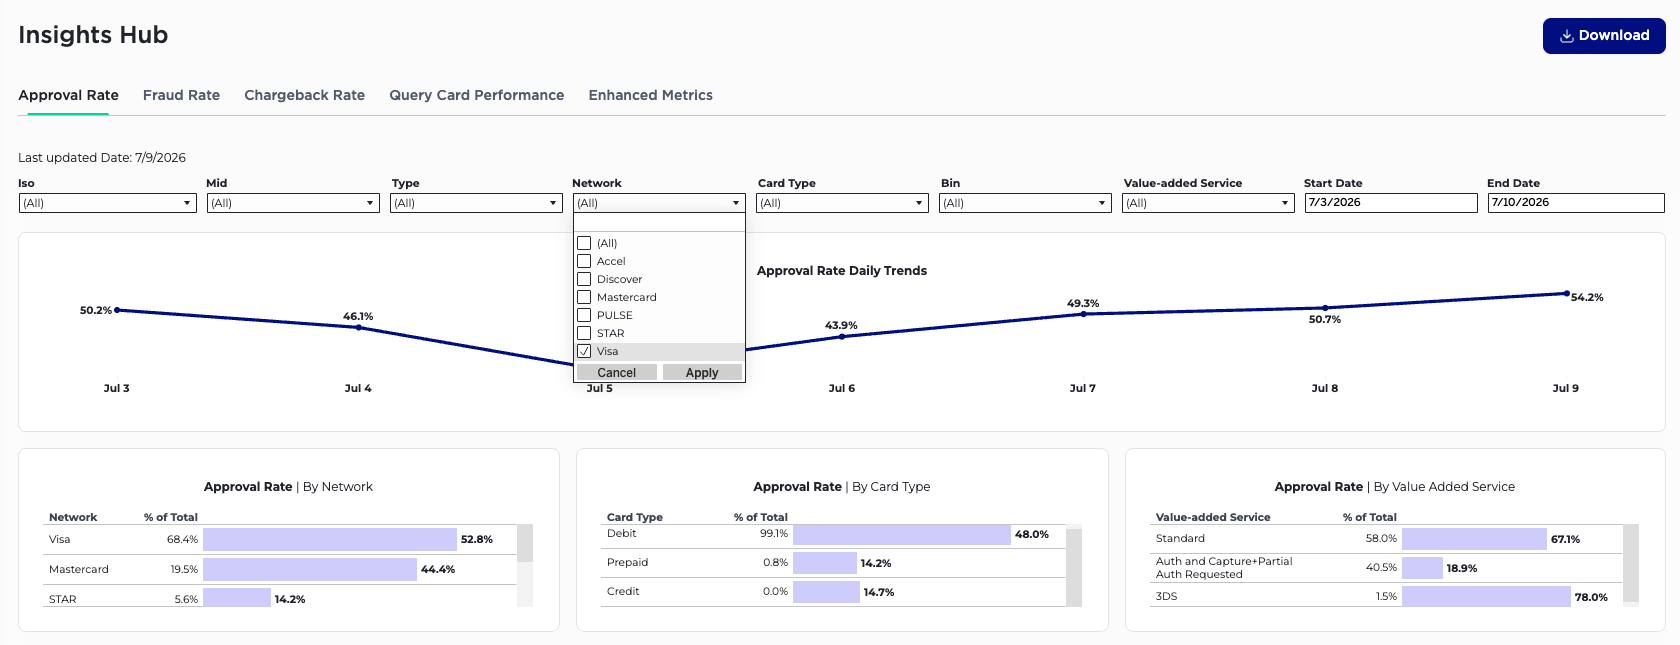
- To filter to a specific approval metric, select a dropdown in a category.
Example:
Approval rates for the Visa network only:
4. Select the Network filter
5. Mark the checkbox for Visa
6. Click Apply.
The dashboard result will filter down to only Visa metrics.
Fraud Rate Metrics
- Select Fraud Rate tab
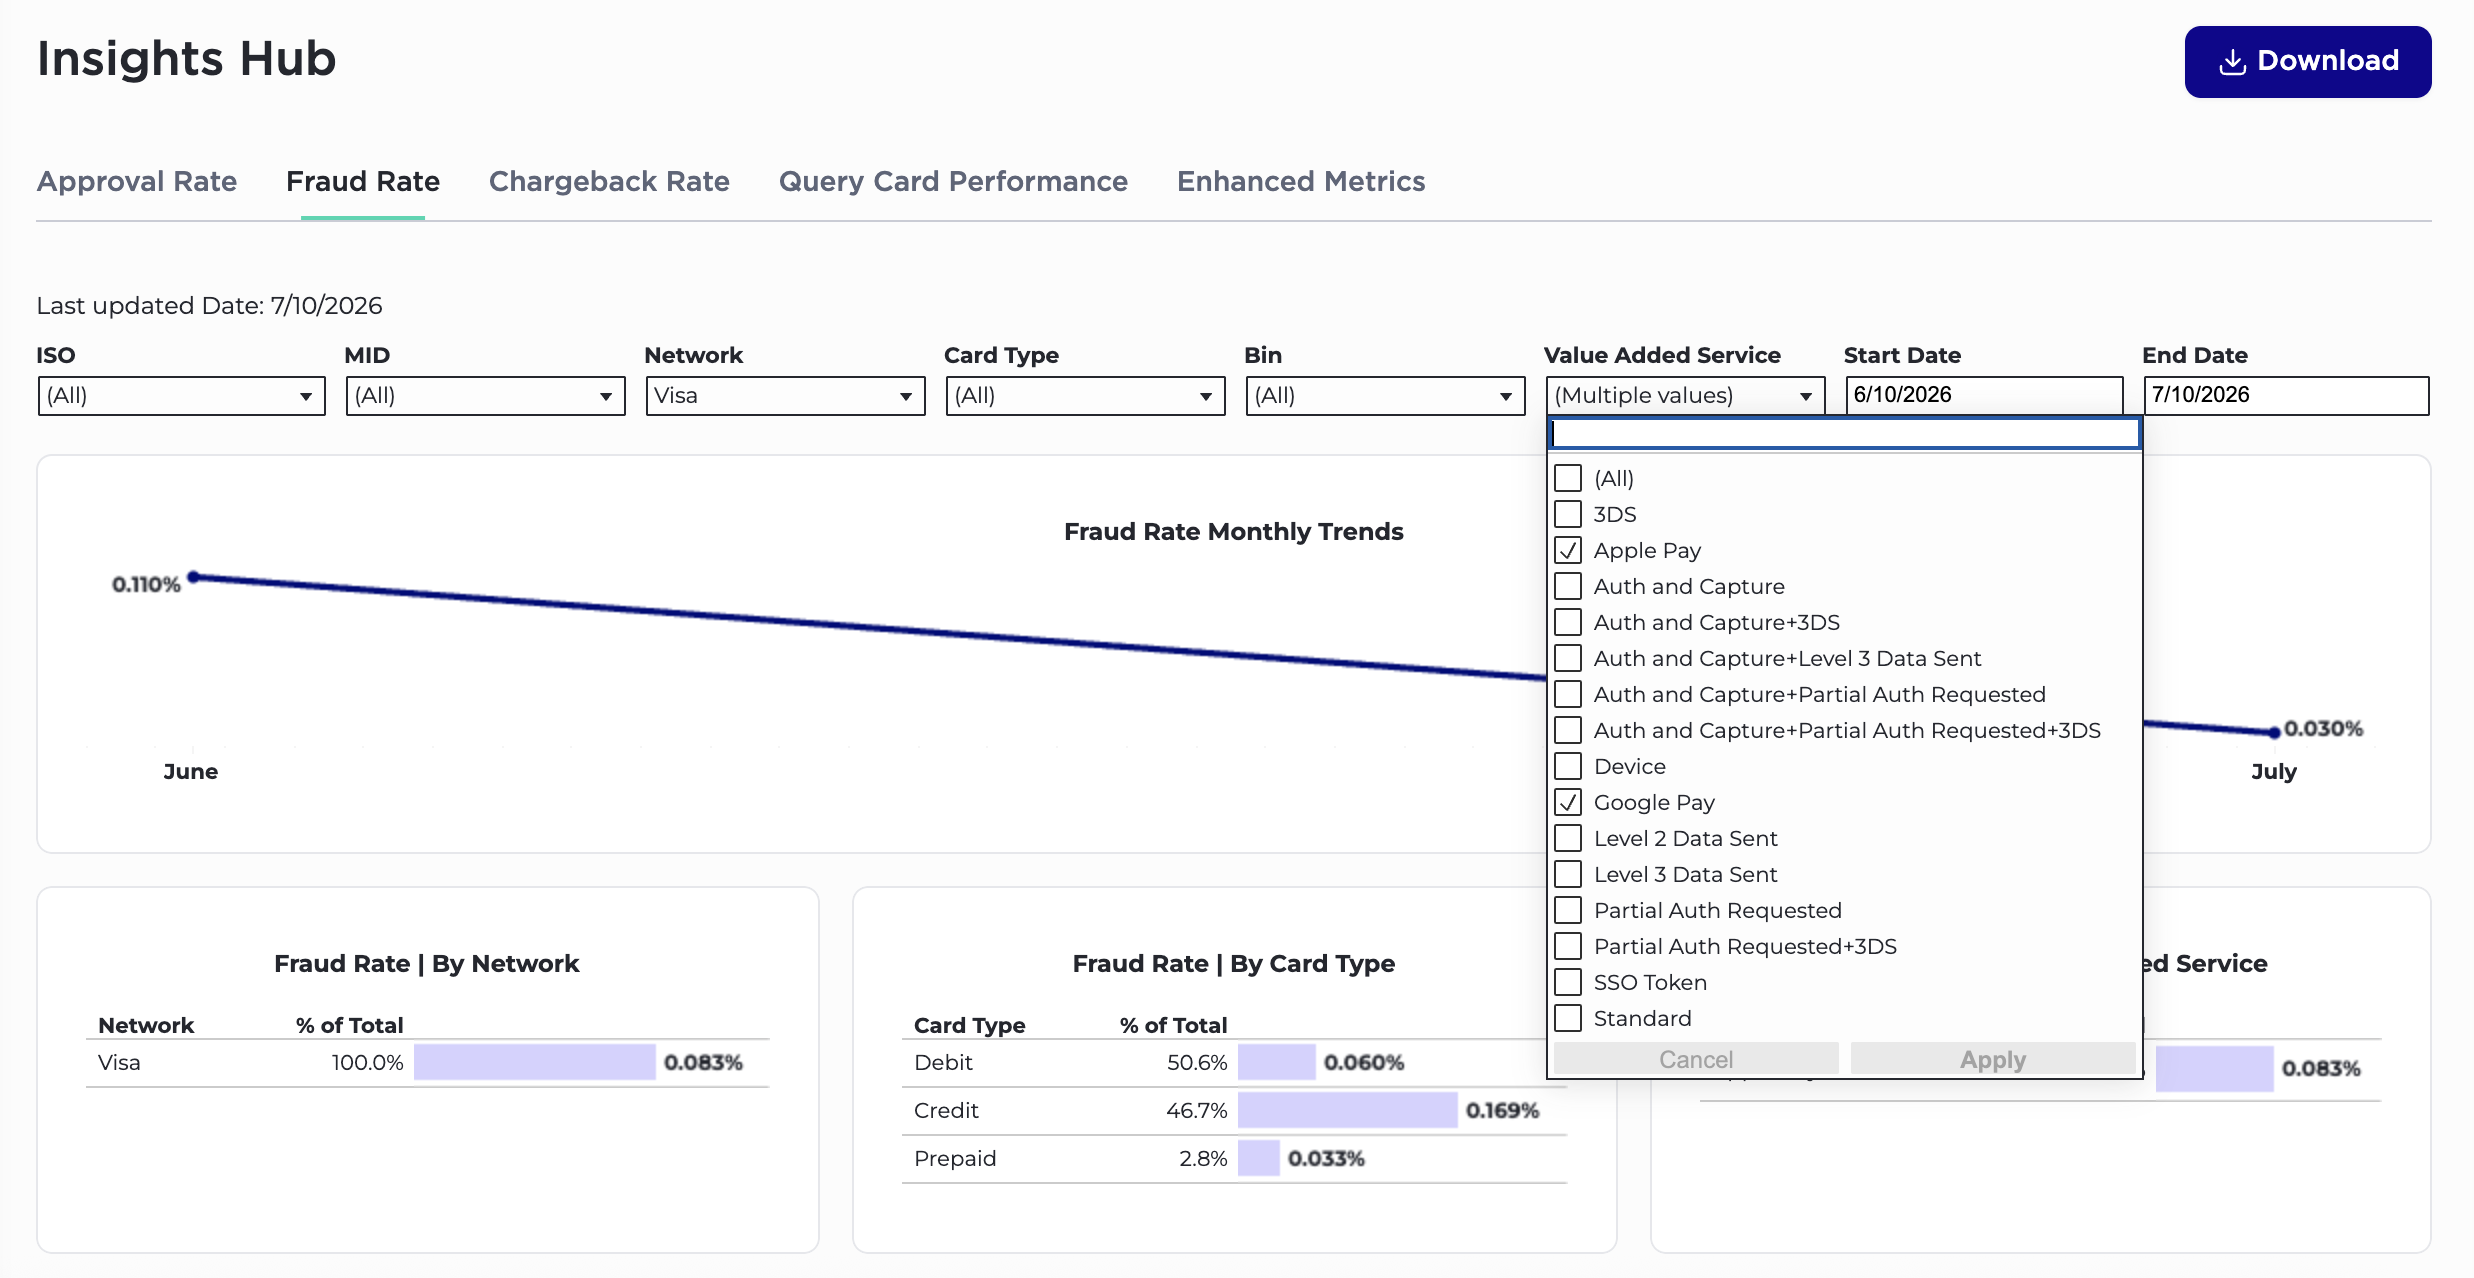
- To filter to a specific Fraud metric select a dropdown in a category.
Example:
Fraud rates for payments made by Apple Pay and Google Pay.
- Select the Value-added Services filter and select the Apple Pay and Google Pay checkboxes.
- Select the Apply button
The dashboard will now automatically update your query
Chargeback Rate
- Select Chargeback Rate tab
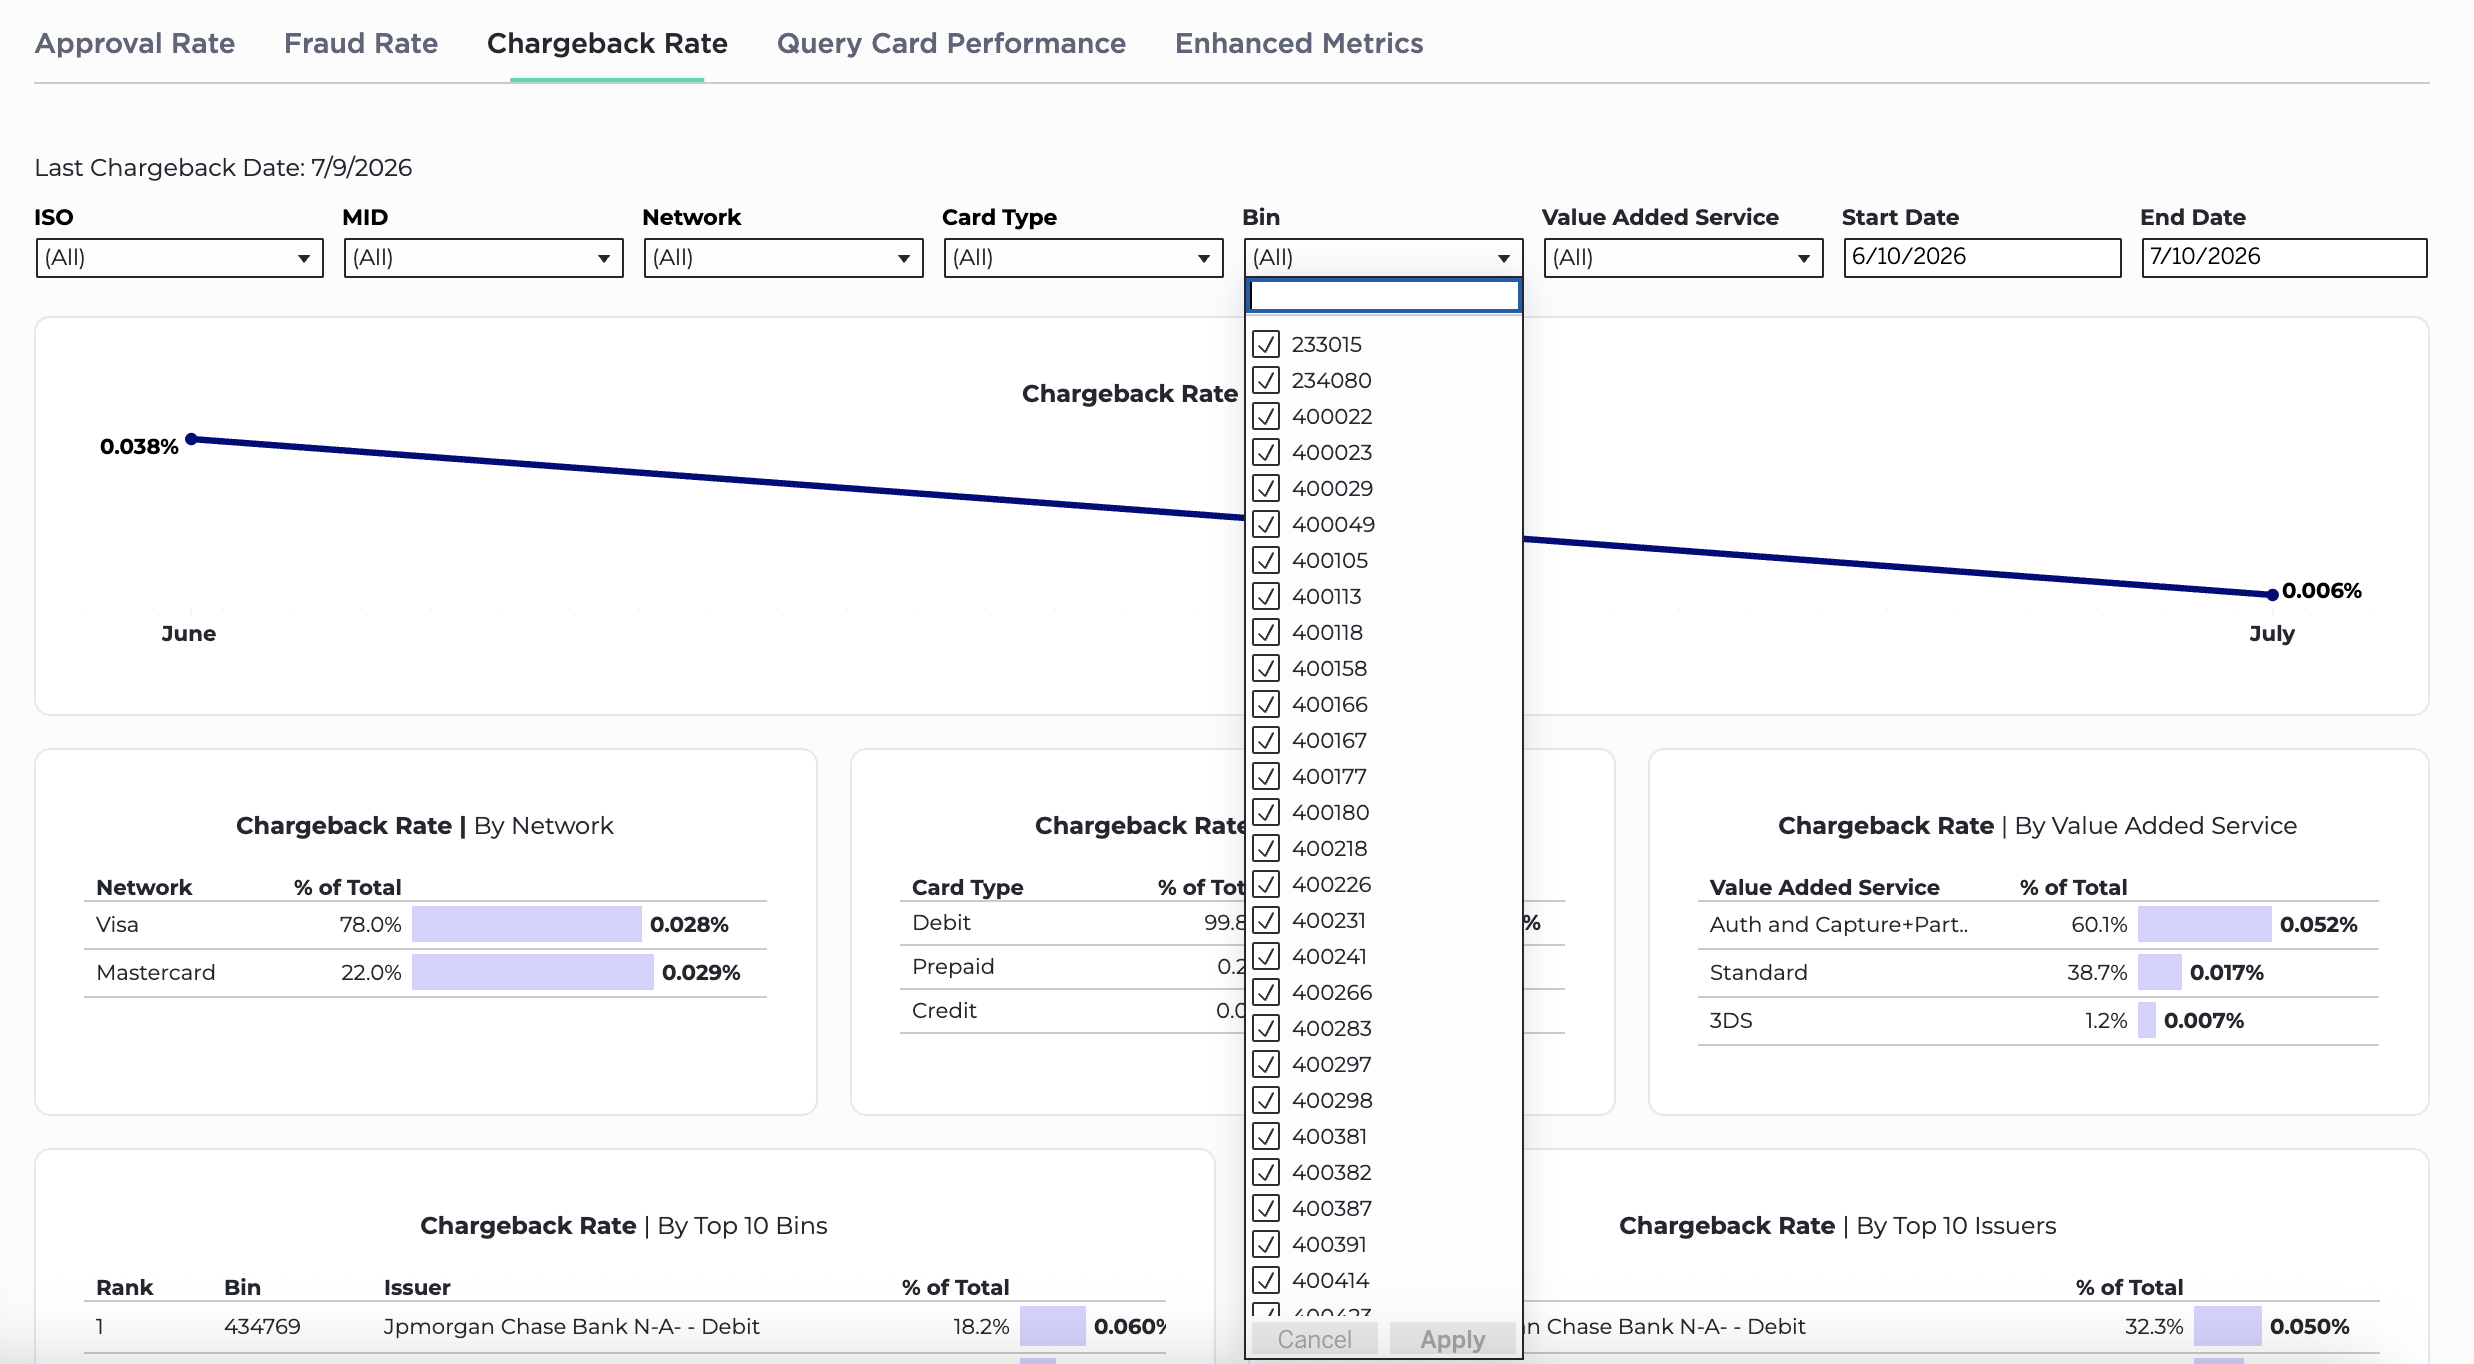
- To filter to a specific Chargeback metric select a dropdown in a category.
Example:
Looking for chargebacks on specific BIN(s)
- Select the BIN filter and choose from multiple available BINs
- Select the Apply button
The dashboard will automatically update your query.
Query Card Performance Metrics
This page provides two performance metrics, AVS and ANI. AVS and ANI are available only if the client has enabled these services with TabaPay.
AVS page is set as the default. To switch to the ANI page, click on the ANI icon.
- To filter to specific Query Card metric, select a dropdown for a category.
Example:
Query Card Performance Metrics for the Visa network only:
1. Select the Network filter
2. Mark the checkbox for Visa
3. Click Apply.
Note: For a screenshot, refer to the Approval Rate example.
Enhanced Metrics
Provides year-to-date payment metrics with a small summary explaining trend cycles.
Download Capabilities
All four metrics have the download functionality.
Two formats are available.
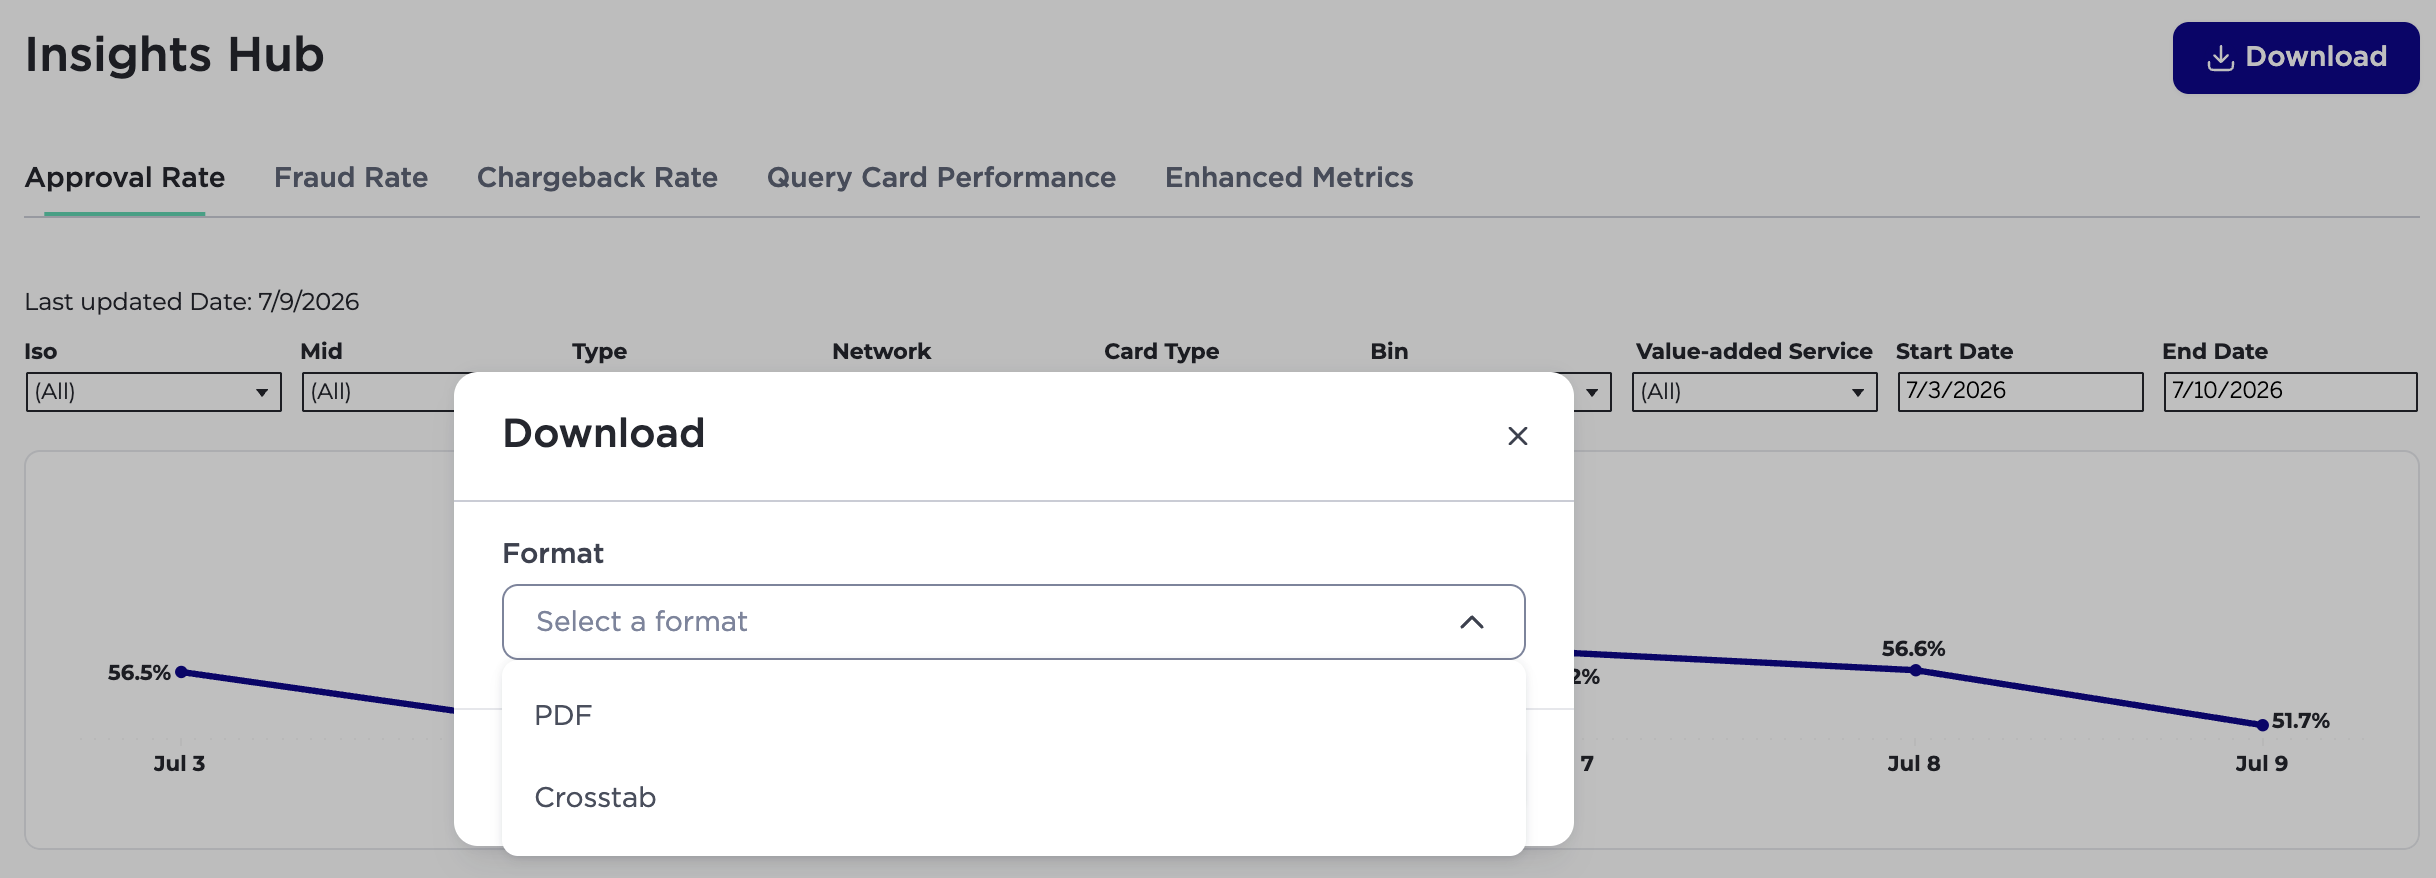
- PDF: Downloads the entire dashboard.
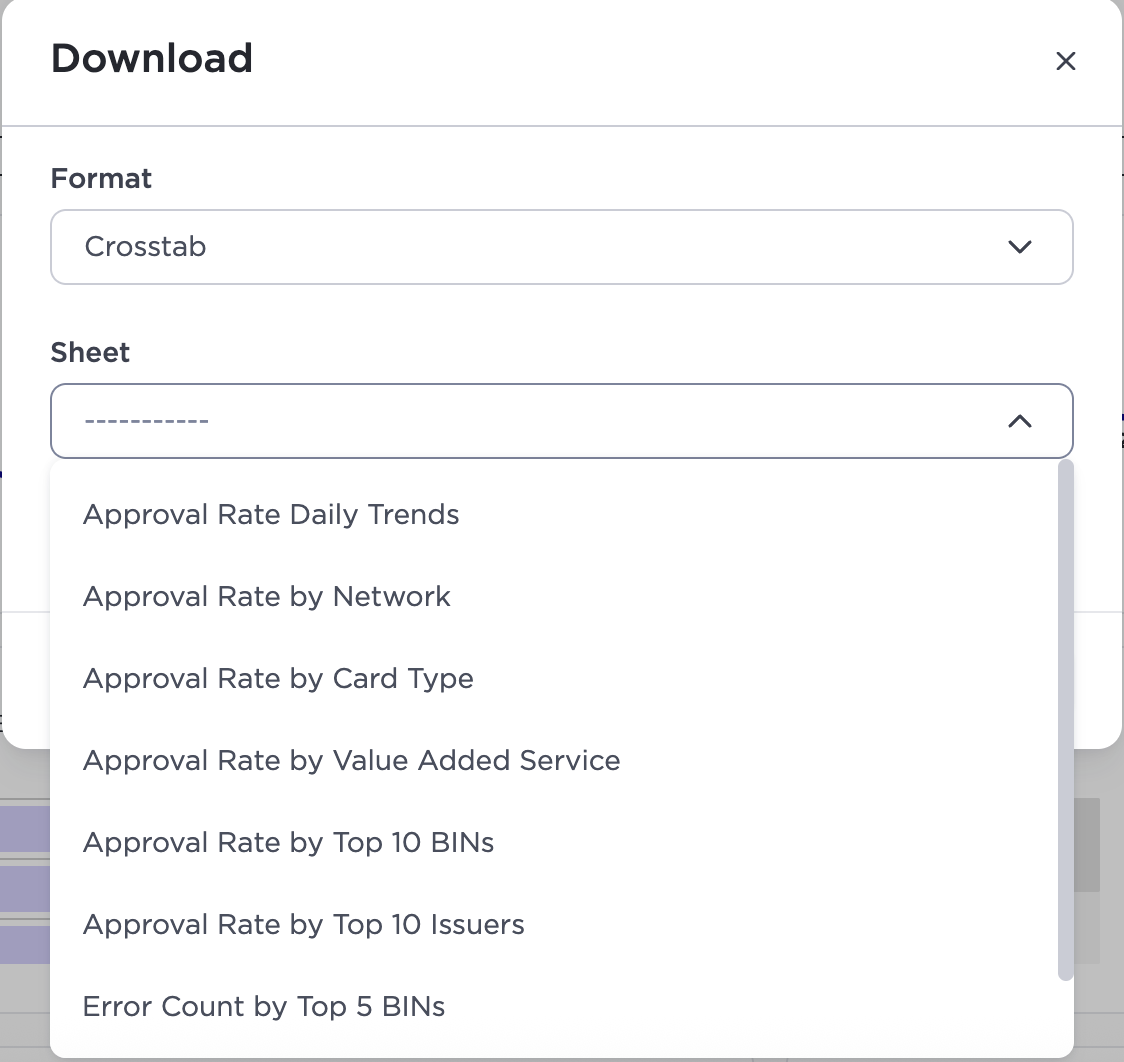
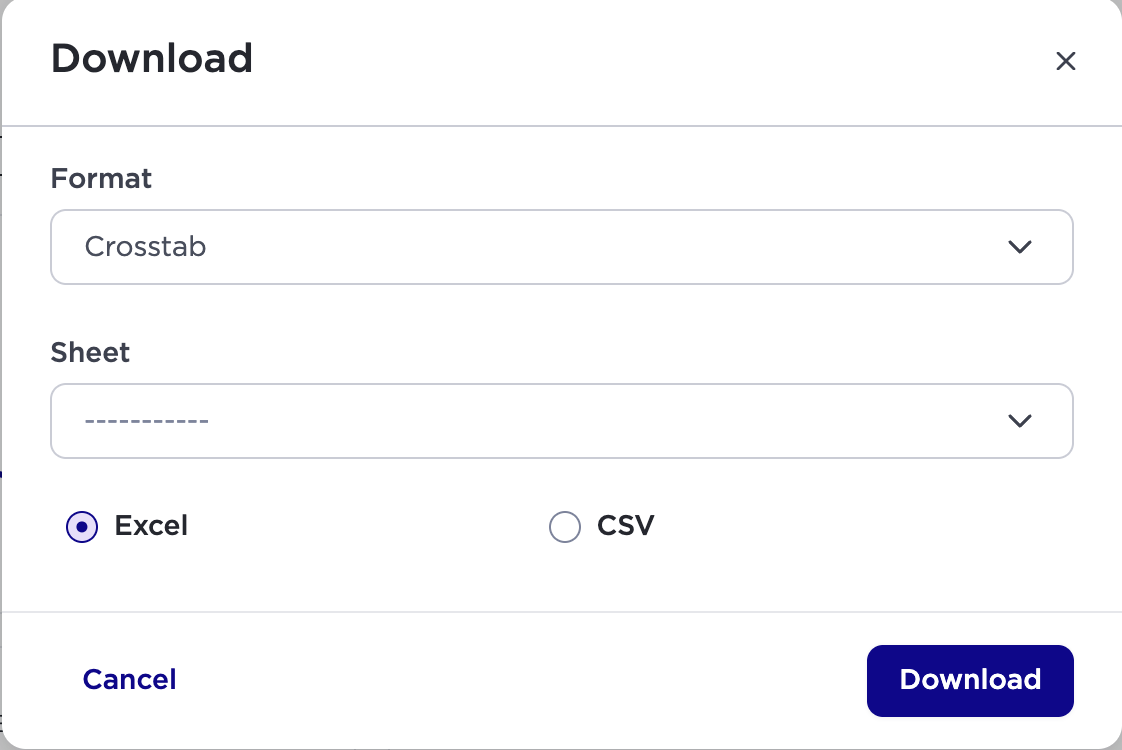
- CrossTabs (Excel, CSV): The user gets to select specific data on the dashboard they want to export via Excel or CSV formats.
-
You can specify different metrics within the Crosstab file.
-
Select Excel or CSV
-
Click Download
Inviting Users to the Insights Hub
Access to the Insights Hub is currently managed manually by TabaPay. Because the feature has a limited number of user seats, an administrator must request access for each team member.
To request access:
- Contact your TabaPay representative or email [email protected].
- Include the following information for each user:
- First and last name
- Company email address (for example, [email protected])
Once the request is approved, TabaPay will enable access for the specified users.
Updated 3 months ago